A cheap token price does not tell you what an accepted business task costs. If you own an enterprise AI budget, retries, human review and infrastructure allocations can change the decision. In July 2026, I took that recurring buyer question to an engineering partner. The resulting requirements and separate prototypes made the comparison more concrete, while an unresolved calculation defect prevented reliance on the demonstrator’s savings figures.
Defining cost per accepted AI task
A token price alone could not answer the question we were discussing. The requirements widened the comparison to the cost of a successful business task, including retries, retrieval, infrastructure allocations, support and operations. A cheap model call can still be part of an expensive workflow. The proposed product needed to make those assumptions visible rather than collapse them into an unexplained savings figure.
My documented contribution was problem discovery, product and requirements direction, partner coordination, and feedback. After the July 21 discussion, I emailed rough prototype thoughts. The engineering partner proposed a functional prototype using its own provider usage data and later reported an initial delivery. That engineering work belongs to the partner. The correspondence does not establish that I personally implemented every screen or connector.
Different kinds of cost need different labels
The FinOps Foundation guidance on unit economics recommends defining decision-relevant unit metrics and documenting their data sources and calculations. It supports the measurement approach, not this simulator or the hypothetical savings below.
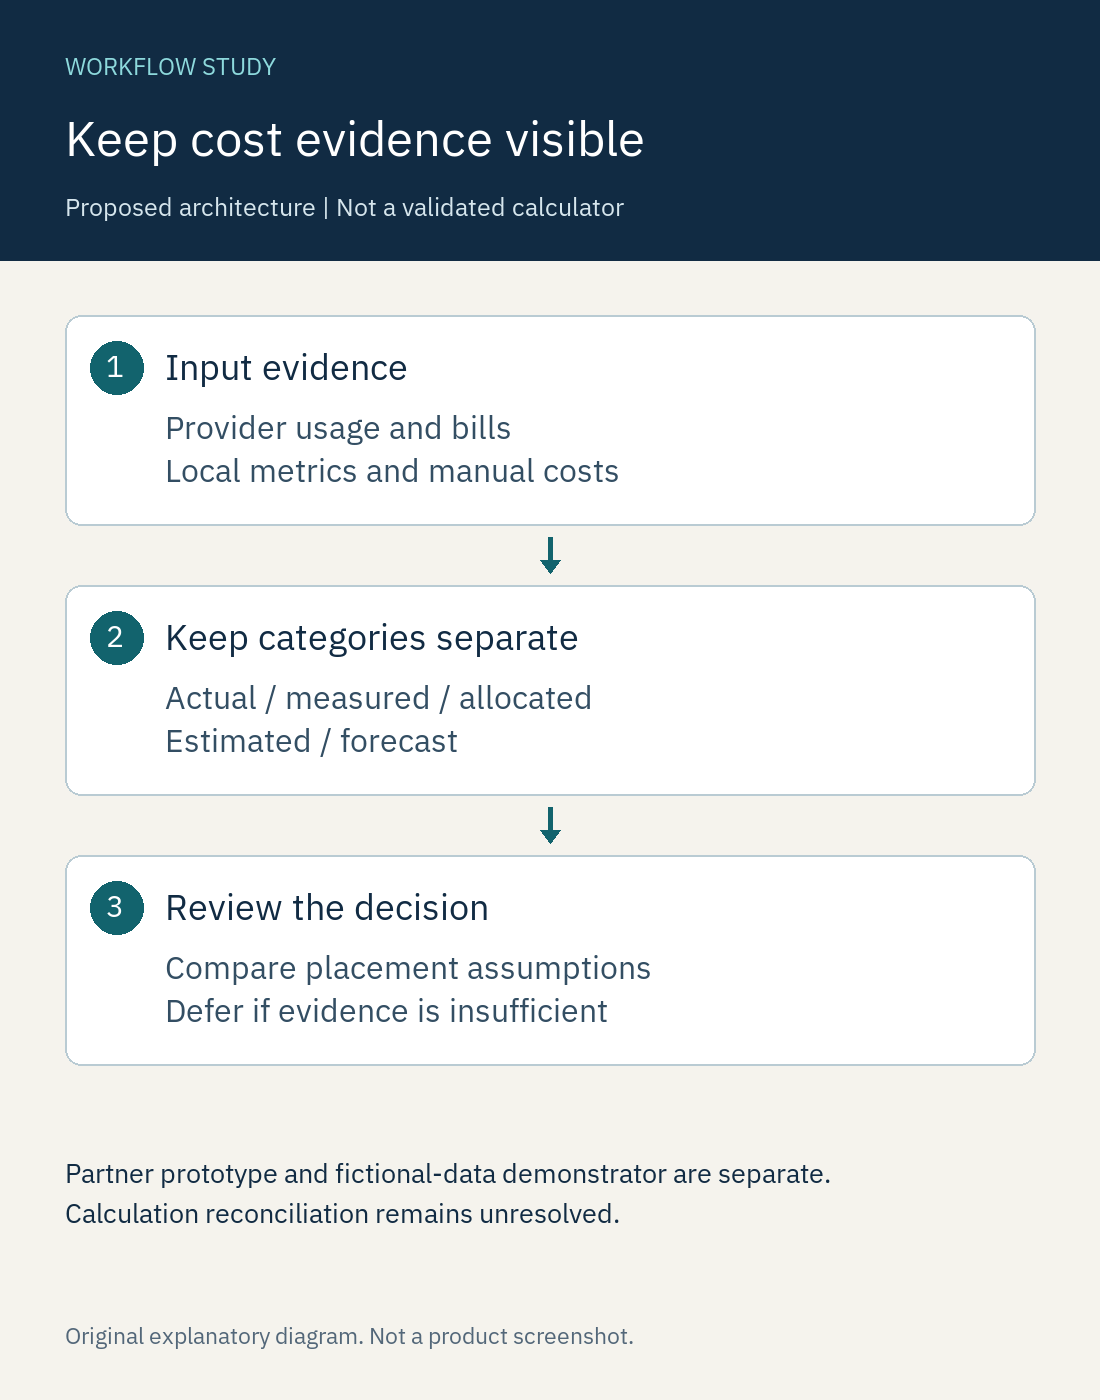
The strategy described a path from collection adapters into a normalized cost ledger, then through rate cards, allocation and forecasting into an explainable placement recommendation. Provider bills, local-model metrics and manual costs were possible inputs. This was a proposed architecture, not a verified inventory of production integrations.
One consequential requirement was to distinguish actual, measured, allocated, estimated and forecast information. A billed amount and an allocation based on an assumption should not appear equally certain. The recommendation also needed to allow cloud, local, edge, hybrid and insufficient-evidence outcomes. A recommendation to buy hardware was never the objective of the comparison.
The proposed operating boundary was advisory: alert, compare and prepare a decision brief for a person to review. Blocking models, buying infrastructure and making production changes were outside that boundary.
Two prototypes with separate evidence
The partner workstream reported provider connections in early August and prompted practical questions about how a new customer would onboard and connect its models. I asked about those handoffs. Tenant onboarding and credential management then appeared in follow-up proposals, which should not be read as proof that a multi-tenant service had shipped.
A separate Bolt demonstrator presented the economics concept through spend, workload, budget and anomaly, placement, recommendation, audit and reporting surfaces. Its organization and figures were fictional. The partner prototype and this demonstrator had different deployment identities. Reported connectors in the partner system cannot be credited to the Bolt application without evidence linking their implementations.
That distinction also limits the outcome story. Later correspondence records outreach to potential customers without much progress and a return to paying opportunities. It does not establish a paid design partner, customer acceptance or production adoption.
The interface got ahead of calculation validation
An August review found that saved scenario figures and the live simulator disagreed materially about the same economics. Selecting the more attractive figure would have hidden the problem. Neither set of numbers belongs in a customer-savings claim.
The proposed repair called for one deterministic calculation module, one immutable model-rate snapshot and one infrastructure scenario per assessment. Saved results and exports would need to agree with that same calculation contract. The repair also narrowed the first version's scope rather than pretending every cost category and hybrid-placement option was already supported.
A historical report describes tests for a separate calculation engine. That does not prove the deployed interface used the engine, and the available record does not establish that the repair shipped. This remains a validation boundary, not a completed turnaround.
What the work produced
The concrete outputs were a requirements and strategy record, partner feedback and delivery correspondence, a partner-reported prototype, and a visually documented fictional-data demonstrator. Together they made the product question specific enough to inspect: which costs are observed, which are assumptions, and what evidence would justify moving a workload?
They did not establish forecast accuracy, reliable recommendations or customer savings. Before anyone relies on the economics, the exact deployed version needs regression checks that reconcile simulator, saved scenario and export results. Customer-specific inputs and an explicit comparison boundary would then be required for a real placement decision.
For the broader budgeting method, see my explanation of cost per accepted business outcome; the case here focuses on the product requirements and unresolved validation boundary.
Projected impact: a scenario to test, not a delivered result
All inputs and calculated amounts in this section are hypothetical sample assumptions, not customer measurements, industry benchmarks or a forecast for this project. They are chosen to make the budgeting arithmetic inspectable. No verified delivered ROI is established for this case.
This arithmetic is independent of both prototypes. It does not use their inconsistent saved figures or simulator outputs and does not imply the engine was repaired. It compares two hypothetical hosted-workload routes, without recommending either route or a hardware purchase.
Assume both routes deliver 10,000 accepted tasks per month at the same quality. Hypothetical baseline: $1,800 provider usage, including retries and retrieval, plus $100 attributable infrastructure, plus 4 support hours and 10 human-review hours. Hypothetical alternative: $1,200 provider usage, $150 infrastructure, 6 support hours and 10 human-review hours. Infrastructure allowances include hosting and energy allocation. Value labor at $60/hour. These are sample budgeting inputs, not provider rates or measured consumption.
- Projected direct operating expense
- Baseline: $1,800 + $100 = $1,900/month. Alternative: $1,200 + $150 = $1,350/month. Potential direct-expense reduction: $550/month, only if the assumed bills actually change.
- Projected cost including support and review
- Baseline: $1,900 + (4 + 10) × $60 = $2,740/month. Alternative: $1,350 + (6 + 10) × $60 = $2,310/month.
- Projected economic cost difference
- $2,740 minus $2,310 = $430/month before migration and implementation. This already includes the extra support effort. Do not add it to the direct-expense reduction.
Labor here is a value allocation, not an assumed payroll reduction. This is recurring monthly cost potential, not incremental revenue or delivered savings. Equal accepted-task quality, workload volume and attributable costs must be validated. More retries, review, support or infrastructure spend can erase the difference. A customer-specific comparison must include every material cost and avoid counting the same expense in both provider and infrastructure budgets.
One-time implementation costs are unknown and excluded, including setup, integration, training and initial validation. Any required migration or hardware acquisition is also excluded and must be priced separately. With that incomplete investment cost basis, no ROI percentage or payback period is claimed. Do not annualize this sample month as a forecast without validating sustained volume, adoption and costs.
Compare one AI workload on a full-cost basis
The eventual decision brief should support AI investment decisions for CFOs, not turn an assumed allocation into a measured saving.
Use billing records, accepted-task counts and a consistent quality standard before comparing routes. Reconcile the exact deployed simulator, saved result and export against one calculation contract. A route that looks cheaper but fails the task is not a substitute.
Bring one workload, its successful-task count and the bills and review effort you can substantiate. We can discuss the missing costs and a comparison that allows an insufficient-evidence answer instead of forcing a recommendation.